ADC Europe Student Awards

Category
Typography
Annual ID
ADCES24_TY003S
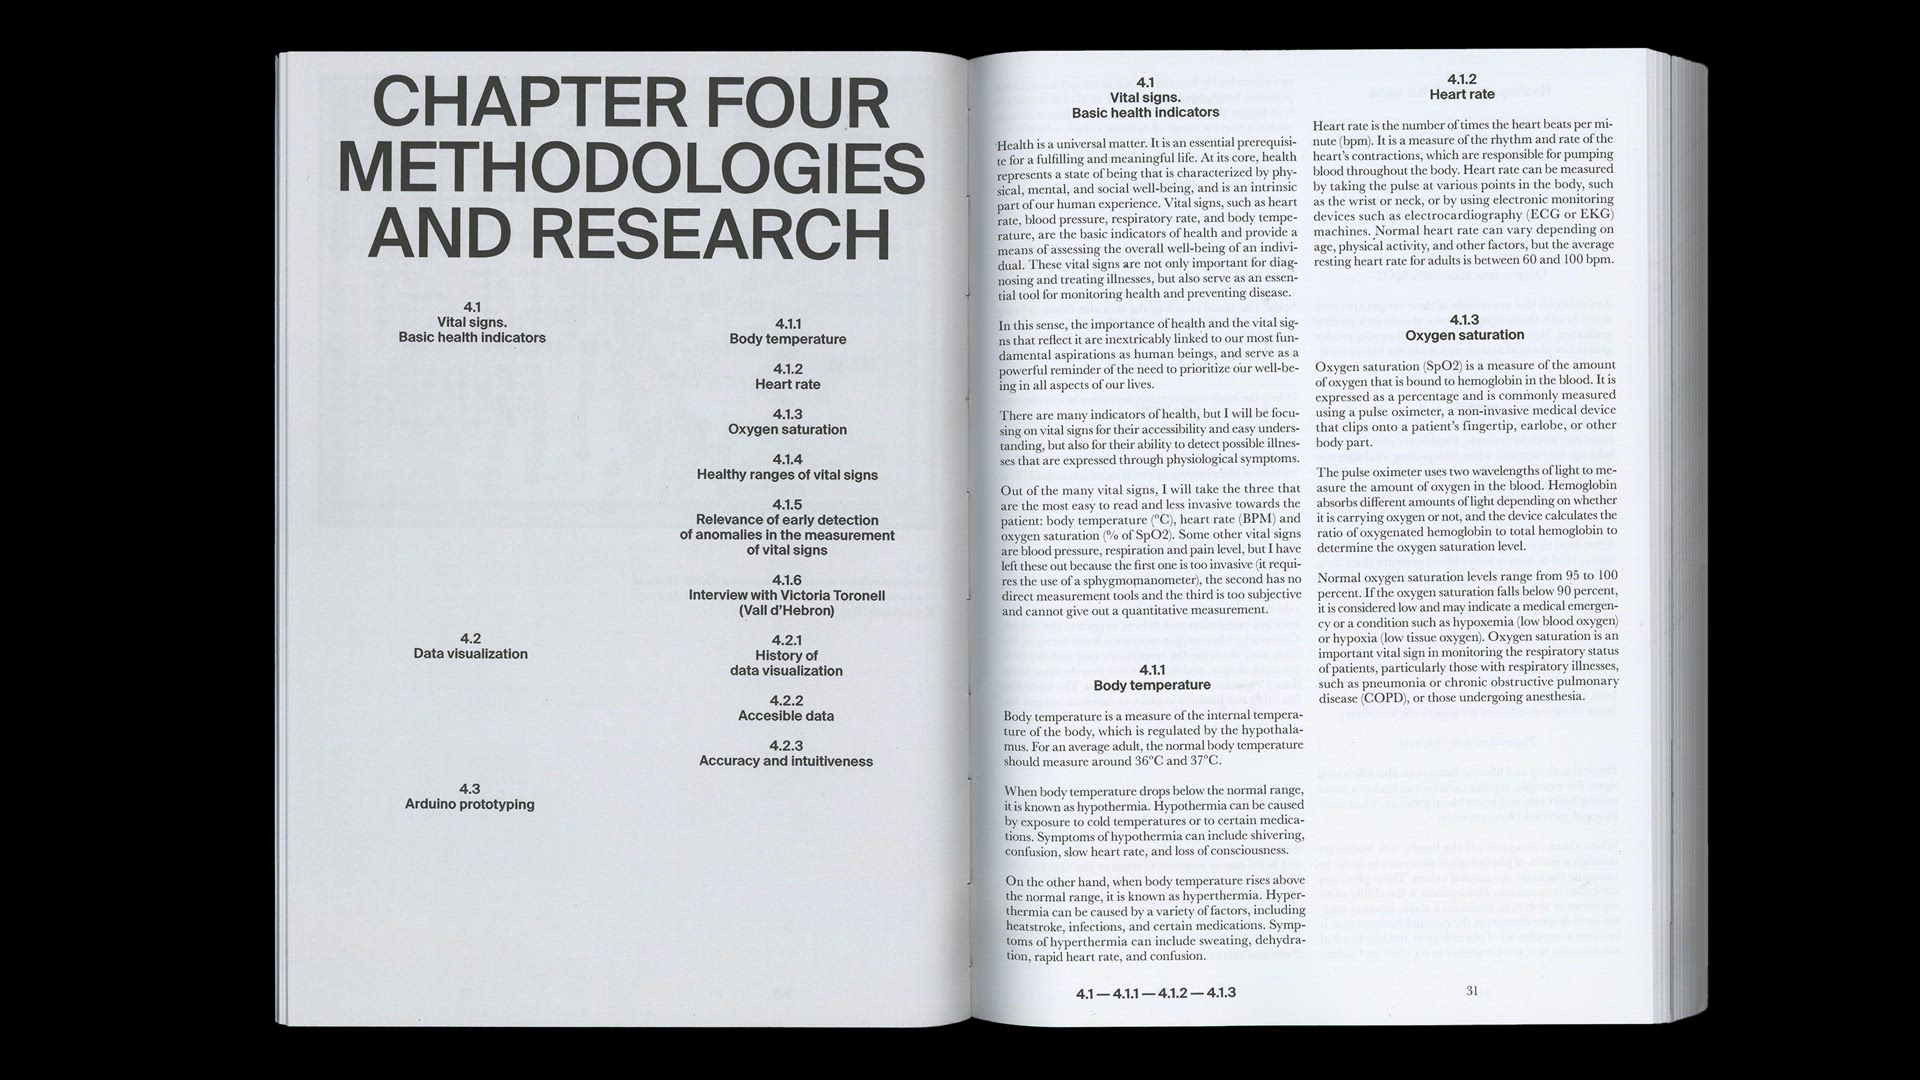
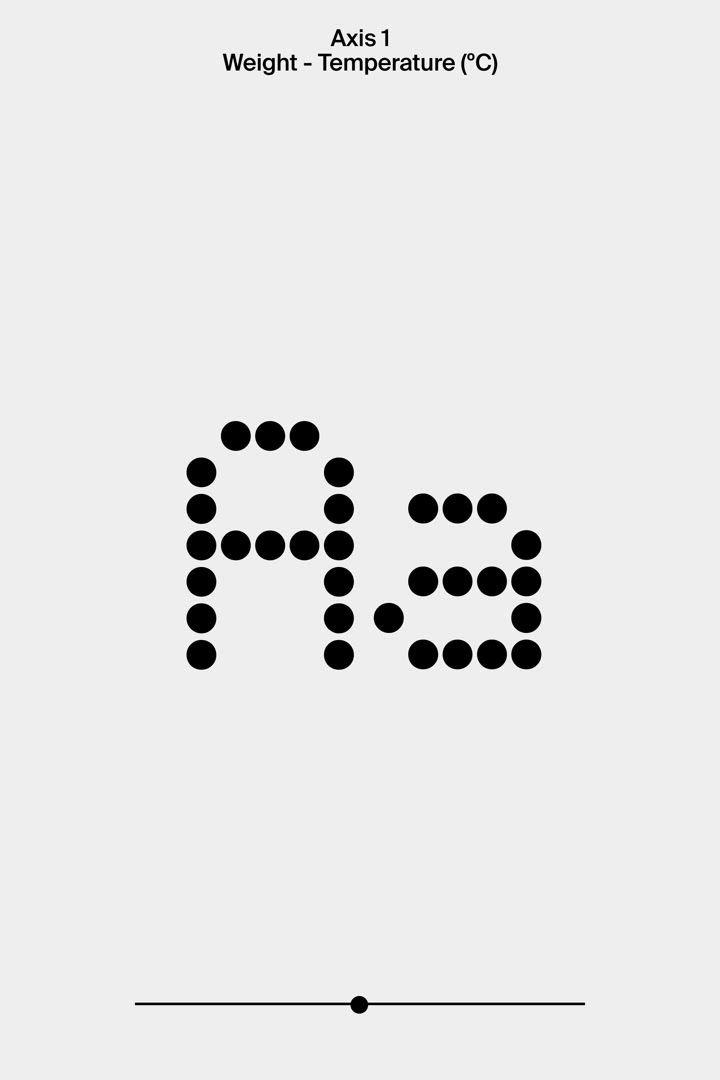
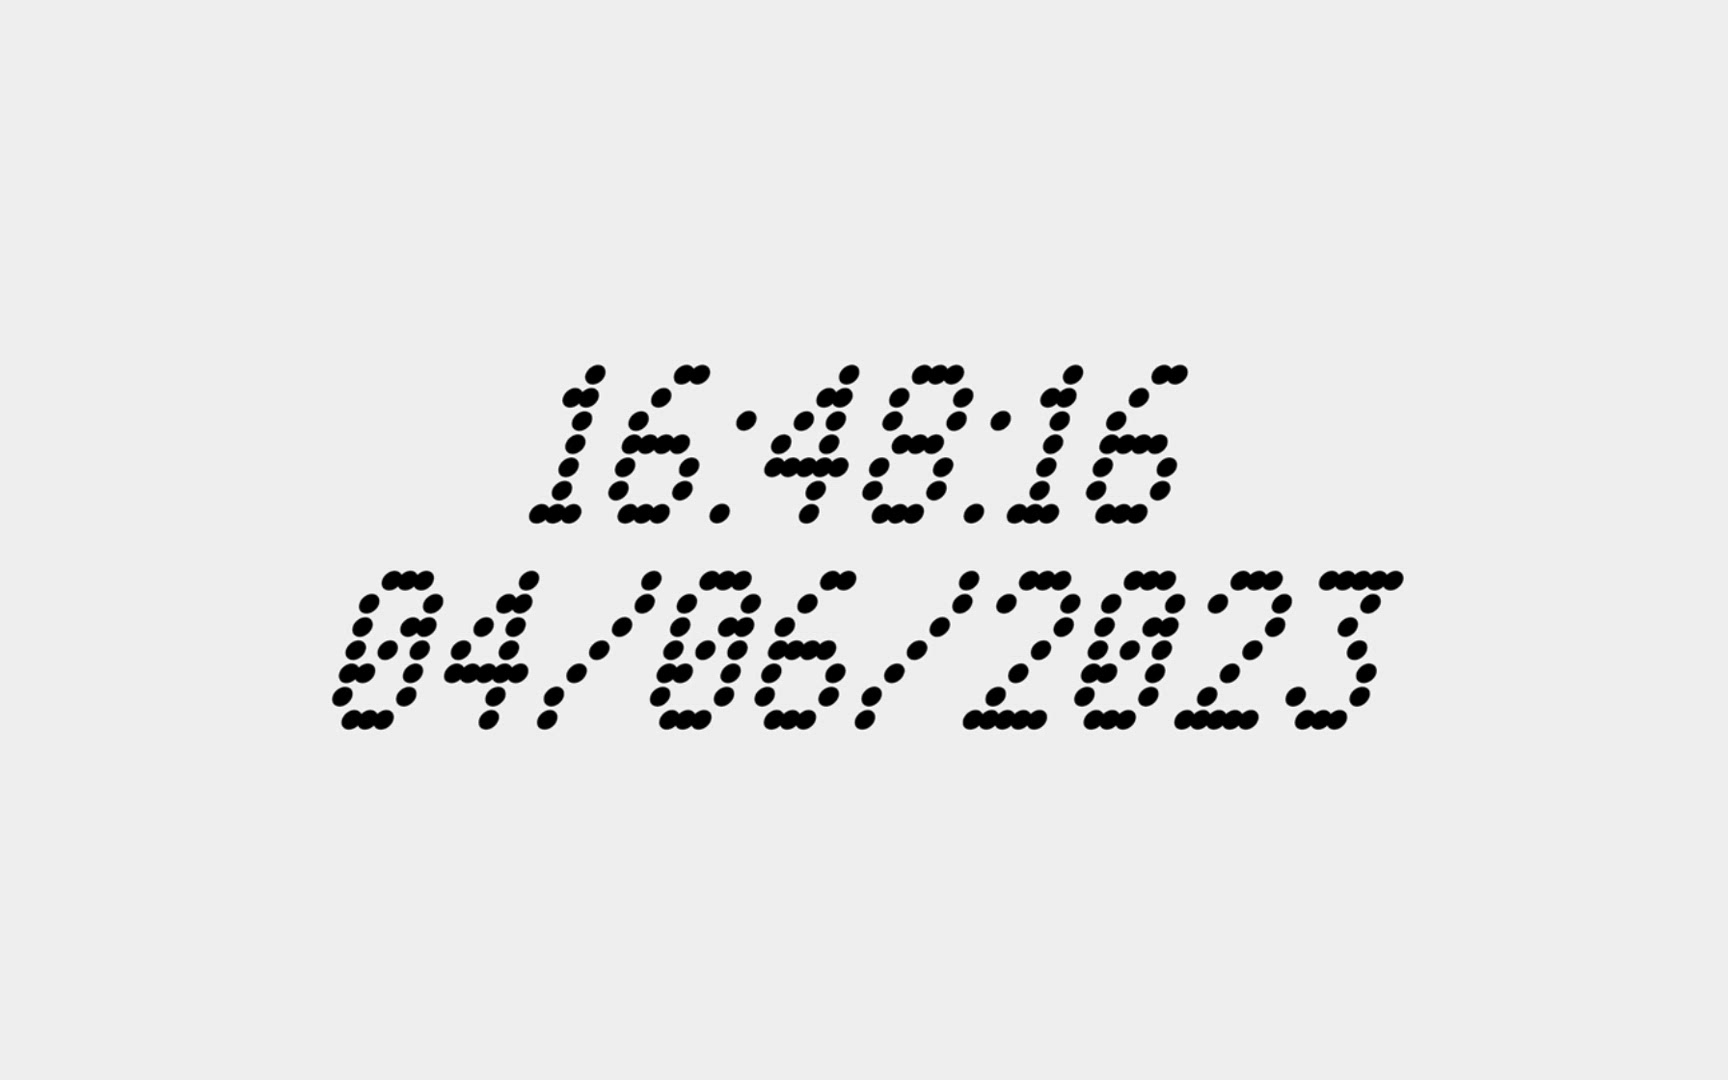
Types per Minute (TPM) is a three-axes variable typeface for health data visualization. Each of the variable axes depict one of the three most important vital signs: body temperature, oxygen saturation and heart rate. Through a pulse oximetry sensor and a virtual monitor, the vitals are represented in real-time in the varying typographic values of weight, width and slant. This allows for a double-layered transmission of information, where the letterforms carry the data, and language carries a message.
The design of the typeface is based on a 5x7 matrix of dots on which the base letters are formed, which are then distorted to visualize the data. When the values received from the sensor are inside the healthy range (36-37ºC, 60-100 bpm, >92% SpO2), the typography reaches the highest readability. Inversely, if the vital signs are off the limits, the variables go to the extremes and the letters become hard to read, alerting of a possible anomaly.
Using variable font technologies to display health information generates an intuitive visual system that would allow for a more effective self control of health vitals, in an engaging interface that promotes a healthier lifestyle. Moreover, a visualization system like such could be further tested and implemented in many other different areas, such as meteorology, stock markets or air quality.
2024 Awards
Total Points: 12
Student Silver Award
Credits
Photographer
Julen Beloki
Programmer
David Barcons
College / University
Elisava School of Design and Engineering / Barcelona
Tutor
Francesc Ribot
Jessica Fernández
Martin Lorenz
Related Awards